260421.1 – Profitability (v.01 Beta)
Hi Everyone,
Today we shipped our first profitability dashboard.
You can find the profitability dashboard under Management > Profitability.
How it works – Indicative (gross) Profitability
The way the page calculates profits is by looking at someone or a team’s salary over time and then juxtaposing that to their collected fees within that same period.
This is based on time sheeted fees which have then been invoiced and collected.
Caveat regarding indicative
Many of you will note that this is not true profitability. The page does not take into account any other costs beyond salary, including incentives or soft costs like rent and utilities.
However, indicative profitability is still a very important benchmark by which you can evenly rank your team members and teams against a very real metric.
Restrictions – Default – Team Leaders cannot see individual salaries
We have introduced a new setting under Company Customisation – General settings which defaults to ‘Off’ in new organisations and upon us shipping this new page. This setting allows an administrator to determine whether someone with Manager Access + Data visibility = Team can view salaries. Note: anyone with data visibility = everything will be unaffected by the setting.
If this is ticked to “Off” then the team leader will not be able to view each individual in their team for profitability, only the total. Similarly, they can view the team tab but they will not get any of the rich context data that would give away someone’s salary.
To allow management access users with Team visibility to see individuals profitability you must first enable their ability to ‘see salaries’.
Features
The page includes the ability to break down profits by team or individual.
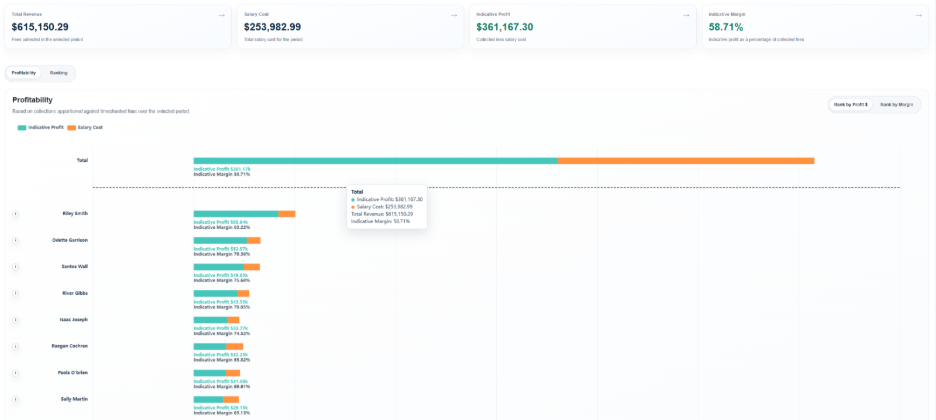
Profitability
For both of these you can see your teams/individuals ranked by either profit or margin, with the total of the bar being their revenue, the orange being their ‘cost’ and the teal being their ‘profit’.
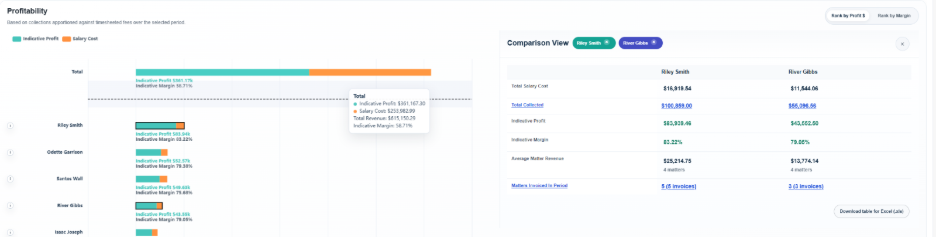
Highlighting any number of team members/teams will bring in a context panel allowing you to interrogate the data:
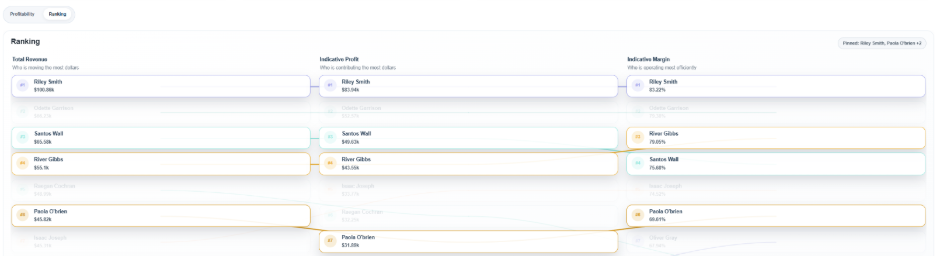
Ranking
If you click on “ranking” you can see all your teams/team members ranked according to revenue but then you can also see how that revenue translates into profits and then into margin. You can compare teams/individuals who have larger revenue but poor margin and visa versa. This will allow you to identify high margin teams who may have good business practices and that out pace larger revenue teams for efficiency. What are those high margin teams doing that other’s could learn from?!
Salaries
This system uses salaries. Salaries can be entered manually in Administration > Manage Users or can be imported via the Xero Integration (recommended if you use Xero).
To integrate with Xero please refer to this helpful video: https://youtu.be/mL3LhG67CU0
Thank you so much everyone,
We’d love some feedback on this page, and on the Comparative Reporting page, both of which are in beta while we await more feedback.
Thank you!
Tom